
Given $S =$ species richness,$A =$ area,$Z =$ slope of the line,and $C =$ $Y$-intercept. If area is on the $X$-axis and species richness is on the $Y$-axis,what will the graph of $\log S = \log C + Z \log A$ look like?
- A
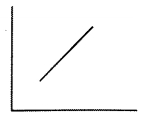
- B
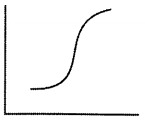
- C
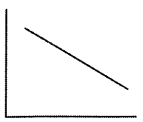
- D
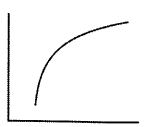
Explore More
Similar Questions
According to the concept of species-area relations $-$
Medium
View SolutionProvide detailed information about the species-area relationship with the help of a graph. Explain the representation of the species-area relationship and how it becomes linear on a logarithmic scale.
Medium
View SolutionGiven below are two statements.
Statement-$I$: Availability of intense sunlight,warmer temperature and higher annual rainfall in the tropics are responsible for species richness of fruit-yielding trees.
Statement-$II$: The variety of frugivorous organisms is more in the tropics as compared to the temperate regions.
In light of the above statements,choose the most appropriate answer from the options given below.
Statement-$I$: Availability of intense sunlight,warmer temperature and higher annual rainfall in the tropics are responsible for species richness of fruit-yielding trees.
Statement-$II$: The variety of frugivorous organisms is more in the tropics as compared to the temperate regions.
In light of the above statements,choose the most appropriate answer from the options given below.
Species diversity decreases as we move away from the equator towards the poles. What could be the possible reasons?
Easy
View SolutionWhich is not a reason for maximum diversity in the tropics?
Medium
View SolutionVedclass Products
For Students
Vedclass Test Series
Mock tests in real JEE/NEET style with performance analysis. 5-day free trial.
Start Free TrialFor Teachers
Exam Paper Generator
Generate Set A/B/C/D exam papers from 7.5L+ questions in 2 minutes. 3 chapters free.
Try FreeFor Institutes
Online Exam Module
Live online exams with unlimited students, 360° analytics & white-label branding.
See Demo