
Medium
$A$ capacitor of $2\,\mu F$ capacitance is charged steadily from $0$ to $5\,C$. Which of the following graphs correctly represents the variation of potential difference across its plates with respect to the charge on the capacitor?
- A
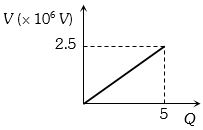
- B
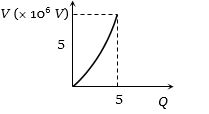
- C
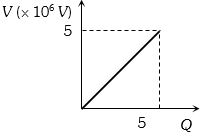
- D
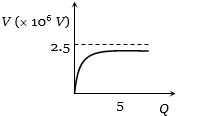
Explore More
Similar Questions
$A$ capacitor of $50 \,\mu {F}$ is connected in a circuit as shown in the figure. The charge on the upper plate of the capacitor is $......\,\mu {C} .$
Initially, $n$ identical capacitors are joined in parallel, and are charged to potential $V$. Now they are separated and joined in series. Then:
DifficultMHT CET 2026
View SolutionThe capacities and connection of five capacitors are shown in the adjoining figure. The potential difference between the points $A$ and $B$ is $60\;V$. Then the equivalent capacity between $A$ and $B$ and the charge on $5\;\mu F$ capacitor will be respectively:
Medium
View SolutionFour capacitors marked with their capacitances and breakdown voltages are connected as shown in the figure. The maximum $EMF$ of the source,so that no capacitor breaks down,is: (in $kV$)
$A$ source of potential difference $V$ is connected to the combination of two identical capacitors as shown in the figure. When key $K$ is closed,the total energy stored across the combination is $E_{1}$. Now key $K$ is opened and a dielectric of dielectric constant $K_{d} = 5$ is introduced between the plates of both capacitors. The total energy stored across the combination is now $E_{2}$. The ratio $E_{1} / E_{2}$ will be:
DifficultJEE MAIN 2022
View SolutionVedclass Products
For Students
Vedclass Test Series
Mock tests in real JEE/NEET style with performance analysis. 5-day free trial.
Start Free TrialFor Teachers
Exam Paper Generator
Generate Set A/B/C/D exam papers from 7.5L+ questions in 2 minutes. 3 chapters free.
Try FreeFor Institutes
Online Exam Module
Live online exams with unlimited students, 360° analytics & white-label branding.
See Demo