
Medium
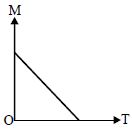
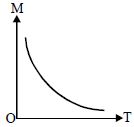
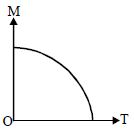
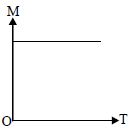
Which of the following curves represents the variation of magnetic moment $(M)$ with temperature $(T)$ for a ferromagnetic material?
- A$A$ linear decrease of $M$ with $T$ reaching zero at the Curie temperature.
- B$A$ hyperbolic decrease of $M$ with $T$.
- C$A$ non-linear decrease of $M$ with $T$ reaching zero at the Curie temperature.
- D$A$ constant value of $M$ with $T$.
Explore More
Similar Questions
At Curie point,a ferromagnetic material becomes
Easy
View SolutionThe Curie-Weiss law is obeyed by iron at a temperature ......
Easy
View SolutionFerromagnetic materials have . . . . . . permeability and . . . . . . retentivity.
Fill in the blank :
$(i)$ The domain size is ...... .
$(ii)$ The domain contains about ...... atoms.
$(i)$ The domain size is ...... .
$(ii)$ The domain contains about ...... atoms.
Medium
View Solution$A$ sample of a paramagnetic salt containing $3 \times 10^{24}$ atomic dipoles each of dipole moment $2 \times 10^{-23} \text{ A-m}^2$ is subjected to a uniform magnetic field of $880 \text{ mT}$ and cooled to a temperature of $3.5 \text{ K}$. The degree of magnetic saturation achieved is $10 \%$. If the sample is subjected to a magnetic field of $990 \text{ mT}$ and cooled to a temperature of $2.1 \text{ K}$, then the total dipole moment of the sample is (in $\text{ A-m}^2$)
Vedclass Products
For Students
Vedclass Test Series
Mock tests in real JEE/NEET style with performance analysis. 5-day free trial.
Start Free TrialFor Teachers
Exam Paper Generator
Generate Set A/B/C/D exam papers from 7.5L+ questions in 2 minutes. 3 chapters free.
Try FreeFor Institutes
Online Exam Module
Live online exams with unlimited students, 360° analytics & white-label branding.
See Demo