
Consider the given plots of vapour pressure $(VP)$ vs temperature $(T / K)$. Which amongst the following options is the correct graphical representation showing $\Delta T_f$,the depression in the freezing point of the solvent in a solution?
- A
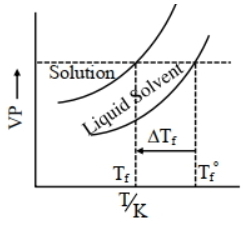
- B
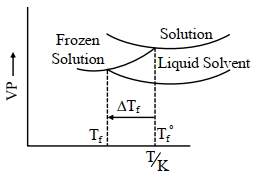
- C
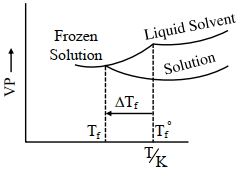
- D
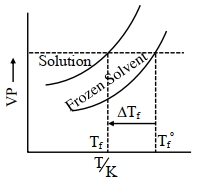
Explore More
Similar Questions
Two solutions $A$ and $B$ are prepared by dissolving $1 \ g$ of non-volatile solutes $X$ and $Y$ respectively in $1 \ kg$ of water. The ratio of depression in freezing points for $A$ and $B$ is found to be $1: 4$. The ratio of molar masses of $X$ and $Y$ is.
Calculate the mass of ascorbic acid ($Vitamin \ C$,$C_6H_8O_6$) to be dissolved in $75 \ g$ of acetic acid to lower its melting point by $1.5^{\circ} C$. $\left[K_f = 3 \ K \ kg \ mol^{-1}\right]$ (in $g$)
Medium
View SolutionWhen a solute is dissolved in a solvent,the freezing point decreases by $0.184 \ ^oC$. What will be the molality of the solution? (Given $K_f = 18.4 \ K \ kg \ mol^{-1}$)
Medium
View SolutionCamphor is used in the determination of molecular mass because $....$
Medium
View SolutionDuring the freezing of a solution at its freezing point,which of the following equilibria exists?
Easy
View SolutionVedclass Products
For Students
Vedclass Test Series
Mock tests in real JEE/NEET style with performance analysis. 5-day free trial.
Start Free TrialFor Teachers
Exam Paper Generator
Generate Set A/B/C/D exam papers from 7.5L+ questions in 2 minutes. 3 chapters free.
Try FreeFor Institutes
Online Exam Module
Live online exams with unlimited students, 360° analytics & white-label branding.
See Demo