
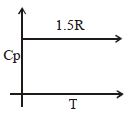
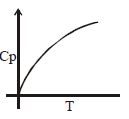
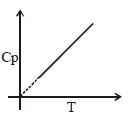
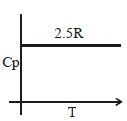
Which graph represents the relationship between heat capacity at constant pressure $(C_p)$ and temperature $(T)$ for a monatomic ideal gas?
- A
- B
- C
- D
Explore More
Similar Questions
The molar heat capacity of water at constant pressure is $75 \ J \ K^{-1} \ mol^{-1}$. When $1.0 \ kJ$ of heat is supplied to $100 \ g$ of water which is free to expand,the increase in temperature of water is $...... \ K$.
$20 \ cal$ of heat is required to increase the temperature of a $15 \ g$ piece of $Al$ metal from $25^{\circ}C$ to $30^{\circ}C$. Calculate the heat capacity,specific heat capacity,and molar heat capacity of the $Al$ piece. (Given: Atomic mass of $Al = 27 \ g \ mol^{-1}$)
Difficult
View SolutionThe $C_{p}$ of $H_{2}O_{(l)}$ is $75.3 \ J \ mol^{-1} \ K^{-1}$. What is the energy (in $J$) required to raise $180 \ g$ of liquid water from $10^{\circ}C$ to $15^{\circ}C$? $(H_{2}O = 18 \ u)$
Heat capacity $(C_{p})$ is an extensive property but specific heat $(c)$ is an intensive property. What will be the relation between $C_{p}$ and $c$ for $1 \ mol$ of water?
Easy
View SolutionThe correct order of molar heat capacities measured at $298 \ K$ and $1 \ bar$ is:
Vedclass Products
For Students
Vedclass Test Series
Mock tests in real JEE/NEET style with performance analysis. 5-day free trial.
Start Free TrialFor Teachers
Exam Paper Generator
Generate Set A/B/C/D exam papers from 7.5L+ questions in 2 minutes. 3 chapters free.
Try FreeFor Institutes
Online Exam Module
Live online exams with unlimited students, 360° analytics & white-label branding.
See Demo