
In an experiment,electrons are made to pass through a narrow slit of width $'d'$ comparable to their de-Broglie wavelength. They are detected on a screen at a distance $'D'$ from the slit (see figure). Which of the following graphs can be expected to represent the number of electrons $'N'$ detected as a function of the detector position $'y'$ ($y = 0$ corresponds to the middle of the slit)?
- A
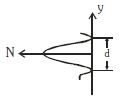
- B
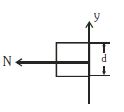
- C
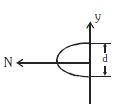
- D
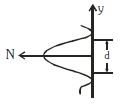
Explore More
Similar Questions
The angular deviation of the $5^{th}$ order dark fringe is $12^{\circ}$ in a single slit experiment. If the width of the slit is $9 \mu m$, then the wavelength of the incident light is: (in $Å$)
$A$ screen is placed $50\,cm$ from a single slit,which is illuminated with $6000\,\mathring{A}$ light. If the distance between the first and third minima in the diffraction pattern is $3\,mm,$ the width of the slit is ......$mm$.
Difficult
View SolutionIn the diffraction pattern of a single slit,the width of the secondary maxima compared to the central maximum is:
Easy
View Solution$A$ parallel beam of fast-moving electrons is incident normally on a narrow slit. $A$ fluorescent screen is placed at a large distance from the slit. If the speed of the electrons is increased,which of the following statements is correct?
Easy
View SolutionObtain the formulas for the angular width and linear width of the central maximum in a single-slit diffraction experiment.
Medium
View SolutionVedclass Products
For Students
Vedclass Test Series
Mock tests in real JEE/NEET style with performance analysis. 5-day free trial.
Start Free TrialFor Teachers
Exam Paper Generator
Generate Set A/B/C/D exam papers from 7.5L+ questions in 2 minutes. 3 chapters free.
Try FreeFor Institutes
Online Exam Module
Live online exams with unlimited students, 360° analytics & white-label branding.
See Demo