
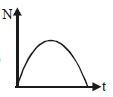
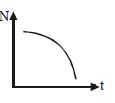
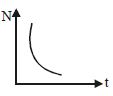
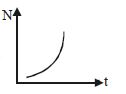
$A$ radioactive element decays to form a stable nuclide. The graph representing the number of radioactive nuclei $(N)$ versus time $(t)$ is:
- A
- B
- C
- D
Explore More
Similar Questions
The phenomenon of radioactivity is
Easy
View Solution$A$ radioactive sample $S_{1}$ having the activity $A_{1}$ has twice the number of nuclei as another sample $S_{2}$ of activity $A_{2}$. If $A_{2} = 2 A_{1}$,then the ratio of half-life of $S_{1}$ to the half-life of $S_{2}$ is
MediumKCET 2010
View SolutionThe decay rate for a certain mass of a radioactive substance measured at different times varies with time as shown in the figure. The count rate at $t = 8 \, hr$ will be:
Difficult
View Solution$90\%$ of a radioactive sample is left undecayed after time $t$ has elapsed. What percentage of the initial sample will decay in a total time $2t$ : ..............$\%$
Medium
View SolutionIf $M_0$ is the initial mass of a radioactive substance with a half-life of ${t_{1/2}} = 5 \text{ years}$,what is the amount of substance remaining after $15 \text{ years}$?
Easy
View SolutionVedclass Products
For Students
Vedclass Test Series
Mock tests in real JEE/NEET style with performance analysis. 5-day free trial.
Start Free TrialFor Teachers
Exam Paper Generator
Generate Set A/B/C/D exam papers from 7.5L+ questions in 2 minutes. 3 chapters free.
Try FreeFor Institutes
Online Exam Module
Live online exams with unlimited students, 360° analytics & white-label branding.
See Demo