
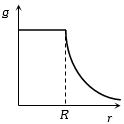
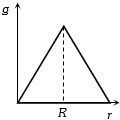
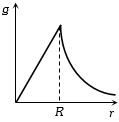
Assuming the density of the Earth is constant, which graph correctly represents the variation of acceleration due to gravity $(g)$ with the distance $(r)$ from the center of the Earth (radius of the Earth $= R$)?
- A
- B
- C
- DNone of these.
Explore More
Similar Questions
$A$ planet has double the mass of the earth. Its average density is equal to that of the earth. An object weighing $W$ on earth will weigh on that planet:
$A$ body weighs $72 \ N$ on the surface of the earth. What is the gravitational force on it at a height equal to half the radius of the earth (in $N$)?
MediumAIIMS 2000
View SolutionAt what height above the surface of the Earth does the value of $g$ decrease by $2 \%$? [Radius of the Earth is $6400 \, km$]
Medium
View Solution$A$ person will get more quantity of matter in $kg-wt$ at which of the following locations?
Easy
View SolutionThe acceleration due to gravity at a height $(1/20)^{th}$ of the radius of the Earth above the Earth's surface is $9 m s^{-2}$. Its value at an equal depth below the surface of the Earth is: (in $m s^{-2}$)
Vedclass Products
For Students
Vedclass Test Series
Mock tests in real JEE/NEET style with performance analysis. 5-day free trial.
Start Free TrialFor Teachers
Exam Paper Generator
Generate Set A/B/C/D exam papers from 7.5L+ questions in 2 minutes. 3 chapters free.
Try FreeFor Institutes
Online Exam Module
Live online exams with unlimited students, 360° analytics & white-label branding.
See Demo