
The charge density $P$ in a nucleus varies with distance $r$ from the centre of the nucleus according to the curve in the figure. Which of the following graphs correctly represents this variation?
- A
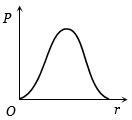
- B
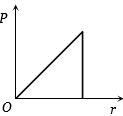
- C
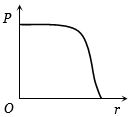
- D
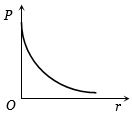
Explore More
Similar Questions
If the radius of the $^{27}_{13}Al$ nucleus is taken to be $R_{Al}$,then the radius of the $^{125}_{53}Te$ nucleus is nearly
MediumAIPMT 1990
View SolutionThe electric potential at the surface of an atomic nucleus $(Z=50)$ of radius $9 \times 10^{-15} \,m$ is
Find the ratio of the radii of the nuclei $_{13}Al^{27}$ and $_{52}Te^{125}$.
Easy
View SolutionIf the radius of a nucleus with mass number $125$ is $1.5 \text{ fermi}$, then the radius of a nucleus with mass number $64$ is: (in $\text{ fermi}$)
The radius of the nucleus of silver (atomic number $Z = 47$) is $3.4 \times 10^{-14} \ m$. Calculate the electric potential on the surface of the nucleus. (Given: $e = 1.6 \times 10^{-19} \ C$,$\frac{1}{4\pi\epsilon_0} = 9 \times 10^9 \ N \ m^2/C^2$)
Easy
View SolutionVedclass Products
For Students
Vedclass Test Series
Mock tests in real JEE/NEET style with performance analysis. 5-day free trial.
Start Free TrialFor Teachers
Exam Paper Generator
Generate Set A/B/C/D exam papers from 7.5L+ questions in 2 minutes. 3 chapters free.
Try FreeFor Institutes
Online Exam Module
Live online exams with unlimited students, 360° analytics & white-label branding.
See Demo