
Class 11PhysicsKinetic Theory of GasesGas Laws (Charles, Boyle's, Avagadro's, Gay Lussacs and Dalton's law) and Ideal gas Equation
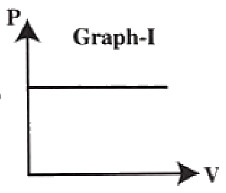
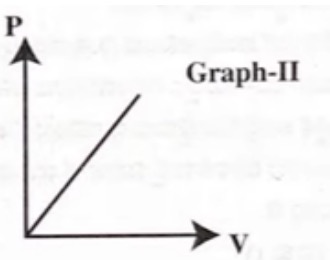
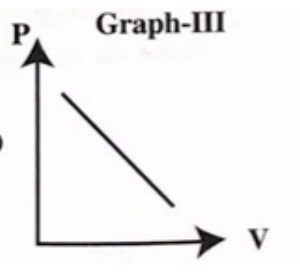
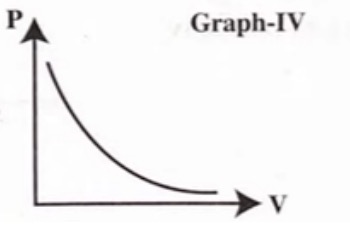
MediumThe graph of pressure $P$ and volume $V$ of $1 \text{ mole}$ of an ideal gas at constant temperature is:
- A
- B
- C
- D
Explore More
Similar Questions
An air bubble of volume $2.9 \ cm^3$ rises from the bottom of a swimming pool $5 \ m$ deep. At the bottom of the pool, the water temperature is $17^{\circ} C$. The volume of the bubble when it reaches the surface, where the water temperature is $27^{\circ} C$, is . . . . . . $cm^3$. ($g = 10 \ m/s^2$, density of water $\rho = 10^3 \ kg/m^3$, and $1 \ atm = 10^5 \ Pa$)
In the figure,the volume of container $X$ is twice the volume of container $Y$. Both contain an ideal gas. The temperature of $X$ is $200 \, K$ and the temperature of $Y$ is $400 \, K$. If the mass of the gas in $X$ is $m$,what will be the mass of the gas in $Y$?
Difficult
View SolutionWhich of the following graphs represents the behavior of an ideal gas? Symbols have their usual meaning.
What is Avogadro number? Write its value.
Medium
View SolutionIf the volume of a given mass of a gas is increased four times,and the temperature is raised from $27^{\circ}C$ to $127^{\circ}C$,what happens to its elasticity?
Medium
View SolutionVedclass Products
For Students
Vedclass Test Series
Mock tests in real JEE/NEET style with performance analysis. 5-day free trial.
Start Free TrialFor Teachers
Exam Paper Generator
Generate Set A/B/C/D exam papers from 7.5L+ questions in 2 minutes. 3 chapters free.
Try FreeFor Institutes
Online Exam Module
Live online exams with unlimited students, 360° analytics & white-label branding.
See Demo