
The graph that does not represent the behaviour of an ideal gas is
- A
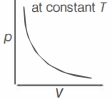
- B
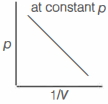
- C
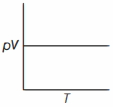
- D$B$ and $C$ both
Explore More
Similar Questions
What will be the effect on the density of $0.09 \ mol$ of a gas at $300 \ K$ if its pressure is increased?
Easy
View Solution$A$ cylinder of $5 \, L$ capacity,filled with air at $NTP$,is connected to another evacuated cylinder of $30 \, L$ capacity. The resultant air pressure in both the cylinders will be .............. $cm$ of $Hg$.
Medium
View Solution$2 \times 10^6$ molecules of $N_2$ gas enter into a vessel having a volume of $400 \, mL$ at $400 \, K$ temperature. Find the pressure in $atm$ and $bar$. $[R = 0.082 \, L \, atm \, mol^{-1} \, K^{-1}]$,$[1 \, atm = 1.013 \, bar]$
Medium
View Solution$A$ closed container is maintained at a constant temperature. It is first evacuated and then an ideal gas is continuously introduced into it. What will be the pressure of the gas inside the container?
Easy
View SolutionThe $\log \, T$ vs $\log \, V$ curve is plotted for an ideal gas as shown. Which of the following is true for the gas?
Medium
View SolutionVedclass Products
For Students
Vedclass Test Series
Mock tests in real JEE/NEET style with performance analysis. 5-day free trial.
Start Free TrialFor Teachers
Exam Paper Generator
Generate Set A/B/C/D exam papers from 7.5L+ questions in 2 minutes. 3 chapters free.
Try FreeFor Institutes
Online Exam Module
Live online exams with unlimited students, 360° analytics & white-label branding.
See Demo