
The graph which represents the variation of mean kinetic energy of molecules with temperature $t^{\circ}C$ is
- A
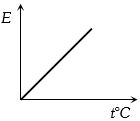
- B
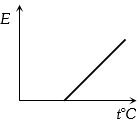
- C
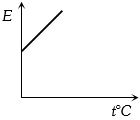
- D
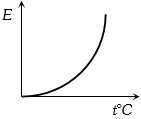
Explore More
Similar Questions
Pheromone is
The value of $c$ in the Lagrange's mean value theorem for $f(x)=\sqrt{x-2}$ in the interval $[2,6]$ is
If the slope of one of the pair of lines represented by $2x^2 + 3xy + Ky^2 = 0$ is $2$,then the angle between the pair of lines is
The direction of the angular velocity vector is along
The number of photo-electrons emitted per second from a metal surface increases when
Vedclass Products
For Students
Vedclass Test Series
Mock tests in real JEE/NEET style with performance analysis. 5-day free trial.
Start Free TrialFor Teachers
Exam Paper Generator
Generate Set A/B/C/D exam papers from 7.5L+ questions in 2 minutes. 3 chapters free.
Try FreeFor Institutes
Online Exam Module
Live online exams with unlimited students, 360° analytics & white-label branding.
See Demo