
The magnetic flux $\phi$ through a coil varies with time $t$ as shown in the diagram. Which graph best represents the variation of the induced electromotive force (e.m.f.) $E$ in the coil with time $t$?
- A
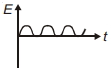
- B
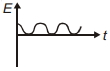
- C
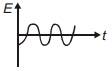
- D
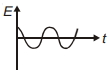
Explore More
Similar Questions
$A$ magnetic field $B = 2t + 4t^{2}$ (where $t$ is time) is applied perpendicular to the plane of a circular wire of radius $r$ and resistance $R$. If all units are in $SI$, the electric charge that flows through the circular wire during $t = 0 \ s$ to $t = 2 \ s$ is:
MediumWBJEE 2013
View SolutionThe direction of induced e.m.f. during electromagnetic induction is given by
Easy
View Solution$A$ coil having $500$ square loops each of side $10\, cm$ is placed normal to a magnetic flux which increases at the rate of $1.0\, T/s$. The induced $e.m.f.$ in volts is:
Medium
View SolutionIn electromagnetic induction,the induced charge in a coil is independent of
Easy
View Solution$A$ system $S$ consists of two coils $A$ and $B$. The coil $A$ carries a steady current $I$. The coil $B$ is suspended nearby as shown in the figure. If the system is heated,so as to raise the temperature of the two coils steadily,then:
MediumAIIMS 2018
View SolutionVedclass Products
For Students
Vedclass Test Series
Mock tests in real JEE/NEET style with performance analysis. 5-day free trial.
Start Free TrialFor Teachers
Exam Paper Generator
Generate Set A/B/C/D exam papers from 7.5L+ questions in 2 minutes. 3 chapters free.
Try FreeFor Institutes
Online Exam Module
Live online exams with unlimited students, 360° analytics & white-label branding.
See Demo