
Medium
The velocity-displacement graph of a particle is shown in the figure. The acceleration-displacement graph of the same particle is represented by:
- A
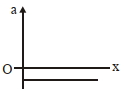
- B
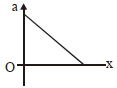
- C
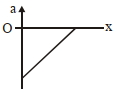
- D
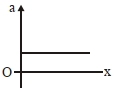
Explore More
Similar Questions
The motion of an airplane is represented by a velocity-time graph as shown below. The distance covered by the airplane in the first $30.5 \ s$ is . . . . . . $km$.
Explain instantaneous velocity.
Easy
View SolutionThe displacement-time graphs of two moving particles make angles of $30^{\circ}$ and $45^{\circ}$ with the time-axis as shown in the figure. The ratio of their respective velocities is:
MediumNEET 2022
View SolutionThe figure shows the $x-t$ plot of a particle in one-dimensional motion. Three different equal intervals of time are shown. In which interval is the average speed greatest,and in which is it the least? Give the sign of average velocity for each interval.
Easy
View SolutionIf a steel ball is dropped from a height onto a marble floor,what will the velocity-time graph look like?
Medium
View SolutionVedclass Products
For Students
Vedclass Test Series
Mock tests in real JEE/NEET style with performance analysis. 5-day free trial.
Start Free TrialFor Teachers
Exam Paper Generator
Generate Set A/B/C/D exam papers from 7.5L+ questions in 2 minutes. 3 chapters free.
Try FreeFor Institutes
Online Exam Module
Live online exams with unlimited students, 360° analytics & white-label branding.
See Demo