
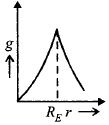
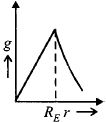
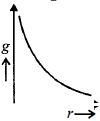
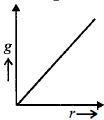
Which graph correctly presents the variation of acceleration due to gravity with the distance from the centre of the earth (radius of the earth $= R_E$)?
- A
- B
- C
- D
Explore More
Similar Questions
How does the acceleration due to gravity change with altitude?
$A$ pendulum is oscillating with frequency $n$ on the surface of the Earth. If it is taken to a depth $d = \frac{R}{2}$ below the surface of the Earth,where $R$ is the radius of the Earth,what is the new frequency of oscillations at this depth?
If the mass of the Earth decreases by $25 \%$ and its radius increases by $50 \%$,then the acceleration due to gravity at its surface decreases by nearly ......... $\%$
Medium
View Solution$Assertion$ : In a free fall,weight of a body becomes effectively zero.
$Reason$ : Acceleration due to gravity acting on a body having free fall is zero.
$Reason$ : Acceleration due to gravity acting on a body having free fall is zero.
Two planets $A$ and $B$ of radii $R$ and $1.5 R$ have densities $\rho$ and $\rho / 2$ respectively. The ratio of acceleration due to gravity at the surface of $B$ to $A$ is:
Vedclass Products
For Students
Vedclass Test Series
Mock tests in real JEE/NEET style with performance analysis. 5-day free trial.
Start Free TrialFor Teachers
Exam Paper Generator
Generate Set A/B/C/D exam papers from 7.5L+ questions in 2 minutes. 3 chapters free.
Try FreeFor Institutes
Online Exam Module
Live online exams with unlimited students, 360° analytics & white-label branding.
See Demo