
Which graph represents the difference between total energy and potential energy of a particle executing $SHM$ versus its distance from the mean position?
- A
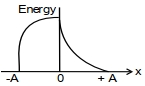
- B
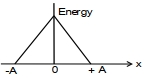
- C
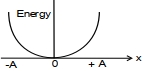
- D
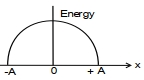
Explore More
Similar Questions
$A$ particle executing simple harmonic motion has a kinetic energy $K = K_0 \cos^2(\omega t)$. The maximum values of the potential energy and the total energy are respectively:
MediumAIPMT 2007
View SolutionThe kinetic energy of a particle,executing simple harmonic motion is $16 \ J$ when it is in the mean position. If the amplitude of motion is $25 \ cm$ and the mass of the particle is $5.12 \ kg$,the period of oscillation is
The total mechanical energy of a particle executing simple harmonic motion is $E$. When the displacement is half the amplitude,its kinetic energy will be
Medium
View SolutionFor a simple pendulum,a graph is plotted between its kinetic energy $(KE)$ and potential energy $(PE)$ against its displacement $d$. Which one of the following represents these correctly? (graphs are schematic and not drawn to scale)
$A$ block kept on a frictionless horizontal surface is connected to one end of a horizontal spring of constant $100 \text{ Nm}^{-1}$ whose other end is fixed to a rigid vertical wall. Initially, the block is at its equilibrium position. The block is pulled to a distance of $8 \text{ cm}$ and released. The kinetic energy of the block when it is at a distance of $3 \text{ cm}$ from the mean position is (in $\text{ J}$)
Vedclass Products
For Students
Vedclass Test Series
Mock tests in real JEE/NEET style with performance analysis. 5-day free trial.
Start Free TrialFor Teachers
Exam Paper Generator
Generate Set A/B/C/D exam papers from 7.5L+ questions in 2 minutes. 3 chapters free.
Try FreeFor Institutes
Online Exam Module
Live online exams with unlimited students, 360° analytics & white-label branding.
See Demo