
Class 11Physics10-1.Thermometry, Thermal Expansion and CalorimetryMix Examples-Thermometry, Thermal Expansion and Calorimetry
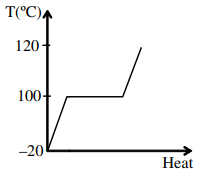
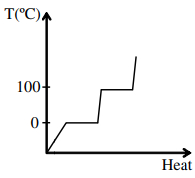
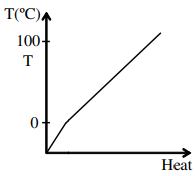
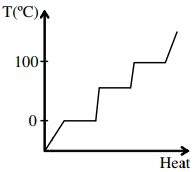
DifficultWhich of the following best represents the temperature versus heat supplied graph for water, in the range of $-20^{\circ}C$ to $120^{\circ}C$?
- A
- B
- C
- D
Explore More
Similar Questions
The pressure applied from all directions on a cube is $P$. How much should its temperature be raised to maintain the original volume? The volume elasticity of the cube is $\beta$ and the coefficient of volume expansion is $\alpha$.
Difficult
View SolutionHeat is being supplied at a constant rate to a sphere of ice which is melting at the rate of $0.1 \, g/s$. It melts completely in $100 \, s$. The rate of rise of temperature thereafter will be ........ $^\circ C/s$ (Assume no loss of heat.)
Difficult
View SolutionGive one example each for solid,liquid,and gas showing expansion with an increase in temperature and contraction with a decrease in temperature.
Medium
View SolutionWhy is cooking faster in a pressure cooker?
Easy
View SolutionAn aluminium container of mass $100 \, g$ contains $200 \, g$ of ice at $-20^{\circ} C$. Heat is added to the system at the rate of $100 \, cal/s$. The temperature of the system after $4$ minutes will be ....... $^{\circ} C$ (specific heat of ice $= 0.5 \, cal/g^{\circ} C$,latent heat of fusion $L = 80 \, cal/g$,specific heat of $Al = 0.2 \, cal/g^{\circ} C$,specific heat of water $= 1 \, cal/g^{\circ} C$)
Vedclass Products
For Students
Vedclass Test Series
Mock tests in real JEE/NEET style with performance analysis. 5-day free trial.
Start Free TrialFor Teachers
Exam Paper Generator
Generate Set A/B/C/D exam papers from 7.5L+ questions in 2 minutes. 3 chapters free.
Try FreeFor Institutes
Online Exam Module
Live online exams with unlimited students, 360° analytics & white-label branding.
See Demo