
Which of the following figures correctly shows the phase relation between the input signal and the output signal of a common-emitter transistor amplifier?
- A
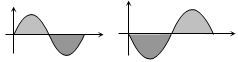
- B
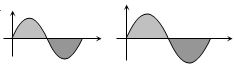
- C
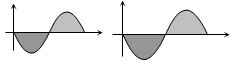
- D
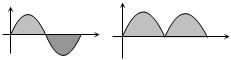
Explore More
Similar Questions
The time variations of signals $A, B$ and $C$ are shown below. Choose the correct statement.
Medium
View SolutionThe figure shows an intrinsic semiconductor $S$ connected in series with a variable resistor $R$ and a constant voltage source $V$. The value of $R$ can be adjusted to maintain a constant current in the ammeter $A$. Under what condition will the semiconductor $S$ get heated? Give reasons.
Medium
View SolutionIn the circuit given below, $V(t)$ is the sinusoidal voltage source. The voltage drop $V_{AB}(t)$ across the resistance $R$ is:
MediumIIT 1993
View SolutionIn an oscillator,if $\beta$ is the feedback factor and $A$ is the gain of the amplifier,then sustained oscillations are obtained when:
The voltage gains of two amplifiers connected in series are $8$ and $12.5$. If the voltage of the input signal is $200 \mu V$, then the voltage of the output signal is
Vedclass Products
For Students
Vedclass Test Series
Mock tests in real JEE/NEET style with performance analysis. 5-day free trial.
Start Free TrialFor Teachers
Exam Paper Generator
Generate Set A/B/C/D exam papers from 7.5L+ questions in 2 minutes. 3 chapters free.
Try FreeFor Institutes
Online Exam Module
Live online exams with unlimited students, 360° analytics & white-label branding.
See Demo