
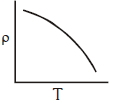
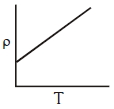
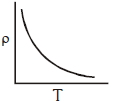
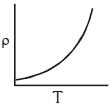
Which of the following graphs represents the variation of resistivity ( $\rho$ ) with temperature $(T)$ for copper?
- A
- B
- C
- D
Explore More
Similar Questions
The resistance of a wire is $20 \Omega$. It is stretched,so that the length becomes three times,then the new resistance of the wire will be (in $\Omega$)
$A$ rectangular parallelopiped is measured as $1\,cm \times 1\,cm \times 100\,cm$. If its specific resistance is $3 \times 10^{-7}\,\Omega\,m$,then the resistance between its two opposite rectangular faces (as shown in the figure) will be $.......... \times 10^{-7} \Omega$.
Assertion: Bending a wire does not affect electrical resistance.
Reason: Resistance of a wire is proportional to the resistivity of the material.
Reason: Resistance of a wire is proportional to the resistivity of the material.
Arrange the following materials in increasing order of their resistivity: Nichrome,Copper,Germanium,Silicon.
Easy
View SolutionThe following figure shows cross-sections through three long conductors of the same length and material,with square cross-sections of edge lengths as shown. Conductor $B$ will fit snugly within conductor $A$,and conductor $C$ will fit snugly within conductor $B$. The relationship between their end-to-end resistance is:
Medium
View SolutionVedclass Products
For Students
Vedclass Test Series
Mock tests in real JEE/NEET style with performance analysis. 5-day free trial.
Start Free TrialFor Teachers
Exam Paper Generator
Generate Set A/B/C/D exam papers from 7.5L+ questions in 2 minutes. 3 chapters free.
Try FreeFor Institutes
Online Exam Module
Live online exams with unlimited students, 360° analytics & white-label branding.
See Demo