
Which of the following graphs correctly represents the variation of heat energy $(U)$ produced in a metallic conductor in a given time as a function of potential difference $(V)$ across the conductor?
- A
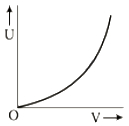
- B
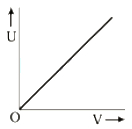
- C
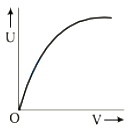
- D
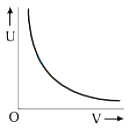
Explore More
Similar Questions
The resistor of resistance $R$ is connected to a $25\, V$ supply and the heat produced in it is $25\, J/s$. The value of $R$ is .......... $\Omega$.
Easy
View SolutionIf the resistance of the filament increases with temperature,what will be the power dissipated in a $220\, V- 100\, W$ lamp when connected to a $110\, V$ power supply?
Easy
View Solution$A$ current of $2\, mA$ was passed through an unknown resistor which dissipated a power of $4.4\, W$. The dissipated power when an ideal power supply of $11\, V$ is connected across it is:
The current density in a circular wire is given by $J(r) = (1 \times 10^5 \text{ A/m}^3) r$,where $r$ is the radial distance and the wire's radius is $2 \text{ mm}$. If the potential applied across the wire is $70 \text{ V}$,then the energy consumed by the wire in $1000 \text{ s}$ is:
The heat produced by a $100\, W$ heater in $2\, minutes$ will be equal to:
Easy
View SolutionVedclass Products
For Students
Vedclass Test Series
Mock tests in real JEE/NEET style with performance analysis. 5-day free trial.
Start Free TrialFor Teachers
Exam Paper Generator
Generate Set A/B/C/D exam papers from 7.5L+ questions in 2 minutes. 3 chapters free.
Try FreeFor Institutes
Online Exam Module
Live online exams with unlimited students, 360° analytics & white-label branding.
See Demo