
Which one of the graphs below best illustrates the relationship between internal energy $U$ of an ideal gas and temperature $T$ of the gas in $K$?
- A
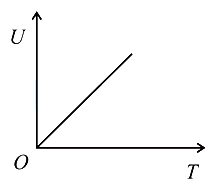
- B
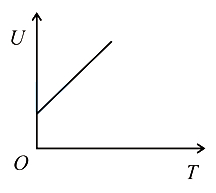
- C
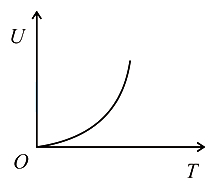
- D
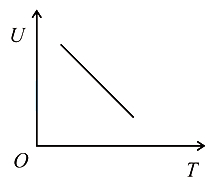
Explore More
Similar Questions
The value of universal gas constant is $8.3\, J/mol/K$. The mean kinetic energy of $32\, g$ of oxygen at $-73^{\circ}C$ will be ...... $J$.
Medium
View SolutionThe pressure exerted by an ideal gas on the walls of a container is
The number of gas molecules striking per second per square metre of the top surface of a table placed in a room at $20^{\circ} C$ and $1$ atmospheric pressure is of the order of (given $k_{B} = 1.4 \times 10^{-23} \, J K^{-1}$ and the average mass of an air molecule is $m = 5 \times 10^{-27} \, kg$).
DifficultKVPY 2017
View SolutionIf the average kinetic energy of a gas molecule at $27^{\circ} C$ is $3.3 \times 10^{-20} \,J$, then the average kinetic energy of the gas molecules at $127^{\circ} C$ is
In the case of hydrogen and oxygen at $N.T.P.$,which of the following quantities is/are the same?
Medium
View SolutionVedclass Products
For Students
Vedclass Test Series
Mock tests in real JEE/NEET style with performance analysis. 5-day free trial.
Start Free TrialFor Teachers
Exam Paper Generator
Generate Set A/B/C/D exam papers from 7.5L+ questions in 2 minutes. 3 chapters free.
Try FreeFor Institutes
Online Exam Module
Live online exams with unlimited students, 360° analytics & white-label branding.
See Demo