
$A$ square loop of side $2 \,cm$ enters a magnetic field with a constant speed of $2 \,cm \,s^{-1}$ as shown. The front edge enters the field at $t=0 \,s$. Which of the following graphs correctly depicts the induced emf in the loop? (Take clockwise direction as positive)
- A
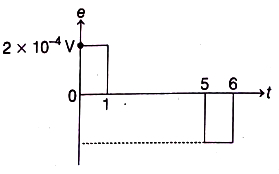
- B
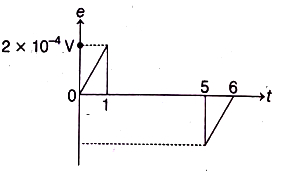
- C
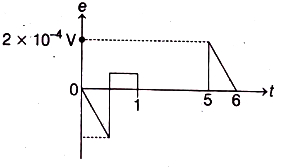
- D
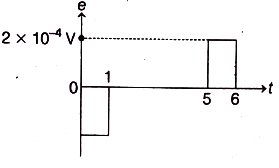
Explore More
Similar Questions
$A$ small bar magnet is moved through a coil at a constant speed from one end to the other. Which of the following series of observations will be seen on the galvanometer $G$ attached across the coil? Three positions shown describe: $(a)$ the magnet's entry,$(b)$ the magnet is completely inside,and $(c)$ the magnet's exit.
$A$ conducting square loop of side $L$,mass $M$ and resistance $R$ is moving in the $XY$ plane with its edges parallel to the $X$ and $Y$ axes. The region $y \geq 0$ has a uniform magnetic field,$\vec{B}=B_0 \hat{k}$. The magnetic field is zero everywhere else. At time $t=0$,the loop starts to enter the magnetic field with an initial velocity $v_0 \hat{\imath} \text{ m/s}$,as shown in the figure. Considering the quantity $K=\frac{B_0^2 L^2}{RM}$ in appropriate units,ignoring self-inductance of the loop and gravity,which of the following statements is/are correct:
$(A)$ If $v_0=1.5 KL$,the loop will stop before it enters completely inside the region of magnetic field.
$(B)$ When the complete loop is inside the region of magnetic field,the net force acting on the loop is zero.
$(C)$ If $v_0=\frac{KL}{10}$,the loop comes to rest at $t=\left(\frac{1}{K}\right) \ln \left(\frac{5}{2}\right)$.
$(D)$ If $v_0=3 KL$,the complete loop enters inside the region of magnetic field at time $t=\left(\frac{1}{K}\right) \ln \left(\frac{3}{2}\right)$.
$(A)$ If $v_0=1.5 KL$,the loop will stop before it enters completely inside the region of magnetic field.
$(B)$ When the complete loop is inside the region of magnetic field,the net force acting on the loop is zero.
$(C)$ If $v_0=\frac{KL}{10}$,the loop comes to rest at $t=\left(\frac{1}{K}\right) \ln \left(\frac{5}{2}\right)$.
$(D)$ If $v_0=3 KL$,the complete loop enters inside the region of magnetic field at time $t=\left(\frac{1}{K}\right) \ln \left(\frac{3}{2}\right)$.
$A$ conducting square loop initially lies in the $XZ$ plane with its lower edge hinged along the $X$-axis. Only in the region $y \geq 0$,there is a time-dependent magnetic field pointing along the $Z$-direction,$\vec{B}(t) = B_0(\cos \omega t) \hat{k}$,where $B_0$ is a constant. The magnetic field is zero everywhere else. At time $t=0$,the loop starts rotating with constant angular speed $\omega$ about the $X$-axis in the clockwise direction as viewed from the $+X$ axis (as shown in the figure). Ignoring self-inductance of the loop and gravity,which of the following plots correctly represents the induced e.m.f. $(V)$ in the loop as a function of time?
The switch $S$ of the circuit shown in the figure is closed at $t = 0$. If $e$ denotes the induced emf in the inductor $L$ and $i$ denotes the current flowing through the circuit at time $t$,which of the following graphs correctly represents the variation of $e$ with time $t$?
Medium
View SolutionAs per the given figure,if $\frac{ dI }{ dt } = -1 \text{ A/s}$,then the value of $V_{AB}$ at this instant will be $.......... \text{ V}$.
Vedclass Products
For Students
Vedclass Test Series
Mock tests in real JEE/NEET style with performance analysis. 5-day free trial.
Start Free TrialFor Teachers
Exam Paper Generator
Generate Set A/B/C/D exam papers from 7.5L+ questions in 2 minutes. 3 chapters free.
Try FreeFor Institutes
Online Exam Module
Live online exams with unlimited students, 360° analytics & white-label branding.
See Demo