
The switch $S$ of the circuit shown in the figure is closed at $t = 0$. If $e$ denotes the induced emf in the inductor $L$ and $i$ denotes the current flowing through the circuit at time $t$,which of the following graphs correctly represents the variation of $e$ with time $t$?
- A
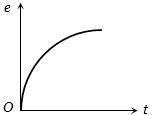
- B
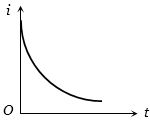
- C
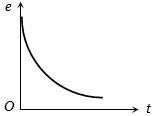
- D
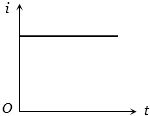
Explore More
Similar Questions
As shown in the figure,$P$ and $Q$ are two coaxial conducting loops separated by some distance. When the switch $S$ is closed,a clockwise current $I_P$ flows in $P$ (as seen by $E$) and an induced current $I_{Q_1}$ flows in $Q$. The switch remains closed for a long time. When $S$ is opened,a current $I_{Q_2}$ flows in $Q$. Then the directions of $I_{Q_1}$ and $I_{Q_2}$ (as seen by $E$) are:
MediumIIT 2002
View SolutionTwo long parallel wires whose centres are at a distance $d$ apart carry equal currents in opposite directions. If the flux within the wires is neglected,the inductance of such an arrangement of wire of length $l$ and radius $a$ will be
Consider the conducting square loop shown in the figure. If the switch is closed and after some time it is opened again,then the square loop will show:
Easy
View SolutionAssertion: $A$ current continues to flow in a superconducting coil even after the switch is off.
Reason: Superconducting coils show the Meissner effect.
Reason: Superconducting coils show the Meissner effect.
The dimension of the ratio of magnetic flux and the resistance is equal to that of:
Medium
View SolutionVedclass Products
For Students
Vedclass Test Series
Mock tests in real JEE/NEET style with performance analysis. 5-day free trial.
Start Free TrialFor Teachers
Exam Paper Generator
Generate Set A/B/C/D exam papers from 7.5L+ questions in 2 minutes. 3 chapters free.
Try FreeFor Institutes
Online Exam Module
Live online exams with unlimited students, 360° analytics & white-label branding.
See Demo