
In an experiment,electrons are passed through a narrow slit of width $d$ equal to their de Broglie wavelength. They are detected on a screen at a distance $D$ from the slit. Which of the following graphs represents the number of electrons $N$ detected as a function of the detector position $y$ ($y = 0$ corresponds to the middle of the slit)?
- A
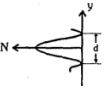
- B
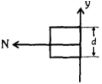
- C
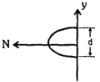
- D

Explore More
Similar Questions
$A$ parallel monochromatic beam of light is incident normally on a narrow slit. $A$ diffraction pattern is formed on a screen placed perpendicular to the direction of the incident beam. At the first maximum of the diffraction pattern,the phase difference between the rays coming from the edges of the slit is
MediumIIT 1998
View SolutionTwo slits are made $1 \; mm$ apart and the screen is placed $1 \; m$ away. What should the width of each slit be to obtain $10$ maxima of the double-slit pattern within the central maximum of the single-slit pattern (in $; mm$)? Blue-green light of wavelength $500 \; nm$ is used.
Easy
View SolutionIn a single slit diffraction experiment, for wavelength $\lambda$, the half angular width of the central maximum is $\theta$. For a wavelength $p\lambda$, the half angular width of the central maximum is $q\theta$. What is the ratio of the half angular widths of the first secondary maximum in the first case to the second case?
DifficultMHT CET 2026
View Solution$A$ slit of size $0.15 \,cm$ is placed at $2.1 \,m$ from a screen. On illuminating it by a light of wavelength $5 \times 10^{-5} \,cm$,the width of the central maxima will be:
Medium
View SolutionThe diffraction of light starts from an obstacle (edge). It depends on ...
Easy
View SolutionVedclass Products
For Students
Vedclass Test Series
Mock tests in real JEE/NEET style with performance analysis. 5-day free trial.
Start Free TrialFor Teachers
Exam Paper Generator
Generate Set A/B/C/D exam papers from 7.5L+ questions in 2 minutes. 3 chapters free.
Try FreeFor Institutes
Online Exam Module
Live online exams with unlimited students, 360° analytics & white-label branding.
See Demo