
Assume a hypothetical wire in which free electron density changes with temperature in proportionality $n \propto T$,assuming $\tau$ (relaxation time of collision) and dimensions of the wire remain unchanged with increasing temperature. Which one of the resistance $v/s$ temperature graphs is true?
- A

- B

- C
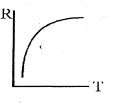
- D
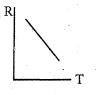
Explore More
Similar Questions
An electric current flows along an insulated strip $PQ$ of a metallic conductor. The current density in the strip varies as shown in the graph. Which one of the following statements could explain this variation?
Medium
View SolutionAs shown in the figure,a current is passing through a conducting wire. The radius of the cross-section of the wire at point $A$ is $3r$ and at point $B$ is $r$. Find the ratio of the drift velocity at point $A$ to that at point $B$.
$A$ metal wire is subjected to a constant potential difference. When the temperature of the metal wire increases,the drift velocity of the electron in it
MediumKCET 2008
View SolutionThe mechanism of the heat produced in a conductor when an electric current flows through it can be explained on the basis of
Easy
View Solution$A$ copper wire of length $1 \ m$ and radius $1 \ mm$ is connected in series with an iron wire of length $2 \ m$ and radius $3 \ mm$. If a current flows through both wires,the ratio of the current density in the copper wire to that in the iron wire will be:
Medium
View SolutionVedclass Products
For Students
Vedclass Test Series
Mock tests in real JEE/NEET style with performance analysis. 5-day free trial.
Start Free TrialFor Teachers
Exam Paper Generator
Generate Set A/B/C/D exam papers from 7.5L+ questions in 2 minutes. 3 chapters free.
Try FreeFor Institutes
Online Exam Module
Live online exams with unlimited students, 360° analytics & white-label branding.
See Demo