
Class 11Physics10-1.Thermometry, Thermal Expansion and CalorimetryHeat Capacity, Specific Heat and Molar Specific Heat
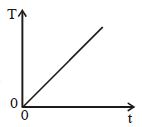
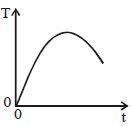
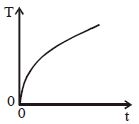
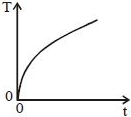
DifficultAt temperatures close to $0\ K$, the heat capacity $C$ of a certain solid is related to its temperature $T$ by the equation $C = aT^3$, where $a$ is a constant characteristic of the solid. Heat is supplied to the solid at a steady rate. Which graph best represents the variation of its temperature $T$ with time $t$?
- A
- B
- C
- D
Explore More
Similar Questions
$4200\, J$ of work is required for:
Medium
View SolutionDraw a graph of the variation of specific heat capacity of water with temperature and define calorie.
Difficult
View SolutionWhy is water used as a coolant in automobile radiators?
Medium
View SolutionThe temperature of $5$ moles of a gas at constant volume is changed from $100^{\circ} C$ to $120^{\circ} C$. The change in internal energy is $80 \,J$. The total heat capacity of the gas at constant volume in $J/K$ is:
What is the heat capacity of a substance?
Easy
View SolutionVedclass Products
For Students
Vedclass Test Series
Mock tests in real JEE/NEET style with performance analysis. 5-day free trial.
Start Free TrialFor Teachers
Exam Paper Generator
Generate Set A/B/C/D exam papers from 7.5L+ questions in 2 minutes. 3 chapters free.
Try FreeFor Institutes
Online Exam Module
Live online exams with unlimited students, 360° analytics & white-label branding.
See Demo