
Figures $A$ and $B$ show two long straight wires of circular cross-section (radii $a$ and $b$ with $a < b$),each carrying a current $I$ which is uniformly distributed across the cross-section. The magnitude of the magnetic field $B$ varies with radial distance $r$ from the axis. Which of the following graphs correctly represents the variation of $B$ with $r$ for both wires?
- A
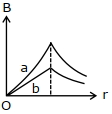
- B
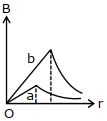
- C
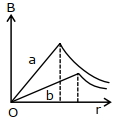
- D
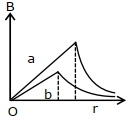
Explore More
Similar Questions
Write the formula for the magnetic field due to a circular current-carrying loop having $N$ turns and $R$ radius at a point on the axis of the loop at a distance $x$ from the center.
Easy
View SolutionThe magnetic field due to a straight conductor of uniform cross-section of radius $a$ and carrying a steady current is represented by
MediumAIIMS 2004
View Solution$Weber/m^2$ is equal to
Easy
View SolutionIn the loop shown,the magnetic induction at the point $O$ is
DifficultKCET 2012
View SolutionAt what distance from a long straight wire carrying a current of $12 \, A$ will the magnetic field be equal to $3 \times 10^{-5} \, Wb/m^2$?
MediumAIIMS 2019
View SolutionVedclass Products
For Students
Vedclass Test Series
Mock tests in real JEE/NEET style with performance analysis. 5-day free trial.
Start Free TrialFor Teachers
Exam Paper Generator
Generate Set A/B/C/D exam papers from 7.5L+ questions in 2 minutes. 3 chapters free.
Try FreeFor Institutes
Online Exam Module
Live online exams with unlimited students, 360° analytics & white-label branding.
See Demo