
Medium
For an exothermic reaction,the following two steps are involved:
Step $1$: $A + B \to I$ $(slow)$
Step $2$: $I \to AB$ $(fast)$
Which of the following graphs correctly represents this reaction?
Step $1$: $A + B \to I$ $(slow)$
Step $2$: $I \to AB$ $(fast)$
Which of the following graphs correctly represents this reaction?
- A
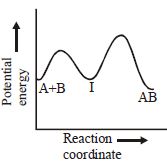
- B
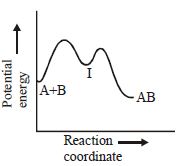
- C
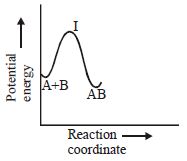
- D
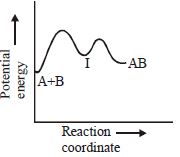
Explore More
Similar Questions
$A$ reaction has an activation energy of $209 \, kJ \, mol^{-1}$. The rate increases $10$-fold when the temperature is increased from $27^{\circ} C$ to $X^{\circ} C$. The temperature $X$ is closest to
[Gas constant,$R = 8.314 \, J \, mol^{-1} \, K^{-1}$ ]
[Gas constant,$R = 8.314 \, J \, mol^{-1} \, K^{-1}$ ]
MediumKVPY 2017
View SolutionIn the given graph,$E_{a}$ for the reverse reaction will be (in $kJ$)
If the half-lives of a first-order reaction at $350 \ K$ and $300 \ K$ are $2 \ s$ and $20 \ s$ respectively,the activation energy of the reaction in $kJ \ mol^{-1}$ is:
At $25\,^{\circ}C$,the values of rate constant,activation energy and Arrhenius constant of a reaction are $3 \times 10^{-4}\, s^{-1}$,$129\, kJ/mol$ and $2 \times 10^{15}\, s^{-1}$ respectively. The value of rate constant as $T \to \infty$ is
Difficult
View Solution$A$ large increase in the rate of a reaction for a rise in temperature is due to:
Medium
View SolutionVedclass Products
For Students
Vedclass Test Series
Mock tests in real JEE/NEET style with performance analysis. 5-day free trial.
Start Free TrialFor Teachers
Exam Paper Generator
Generate Set A/B/C/D exam papers from 7.5L+ questions in 2 minutes. 3 chapters free.
Try FreeFor Institutes
Online Exam Module
Live online exams with unlimited students, 360° analytics & white-label branding.
See Demo