
In an experiment, electrons are made to pass through a narrow slit of width '$d$' comparable to their de Broglie wavelength. They are detected on a screen at a distance '$D$' from the slit (see figure). Which of the following graphs can be expected to represent the number of electrons '$N$' detected as a function of the detector position '$y$' ($y = 0$ corresponds to the middle of the slit)?
- A
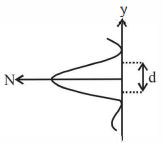
- B
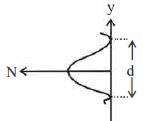
- C
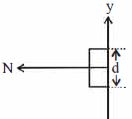
- D
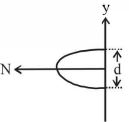
Explore More
Similar Questions
If we observe the single slit Fraunhofer diffraction with wavelength $\lambda$ and slit width $e$,the width of the central maxima is $2\theta$. On decreasing the slit width for the same $\lambda$,what happens to $\theta$?
Easy
View SolutionThe angular width of the central maxima in the Fraunhofer diffraction pattern of a slit is measured. The slit is illuminated by light of wavelength $6000 \ \mathring A$. When the slit is illuminated by light of another wavelength,the angular width decreases by $30\%$. The wavelength of this light will be ...... $\mathring A$.
Medium
View SolutionLight of wavelength $580 \text{ nm}$ is incident normally on a slit of width '$a$'. The distance between the slit and the screen is $2.5 \text{ m}$ and the distance of the second order maximum from the centre of the screen is $14.5 \text{ mm}$ in a diffraction pattern. The value of '$a$' is
DifficultMHT CET 2026
View SolutionIn a single slit diffraction experiment,when the distance of separation between the slit and the screen is doubled,the angular separation between the fringes
The main difference in the phenomenon of interference and diffraction in light waves is that
Easy
View SolutionVedclass Products
For Students
Vedclass Test Series
Mock tests in real JEE/NEET style with performance analysis. 5-day free trial.
Start Free TrialFor Teachers
Exam Paper Generator
Generate Set A/B/C/D exam papers from 7.5L+ questions in 2 minutes. 3 chapters free.
Try FreeFor Institutes
Online Exam Module
Live online exams with unlimited students, 360° analytics & white-label branding.
See Demo