
The number of undecayed nuclei $N$ in a sample of radioactive material as a function of time $t$ is shown in the figure. Which of the following graphs correctly shows the relationship between $N$ and the activity $A$?
- A
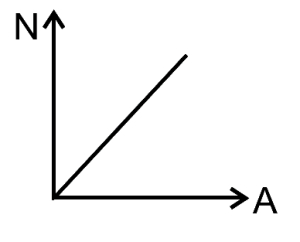
- B
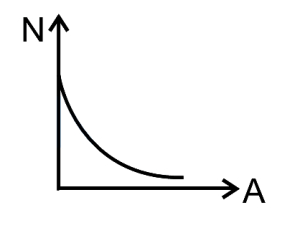
- C
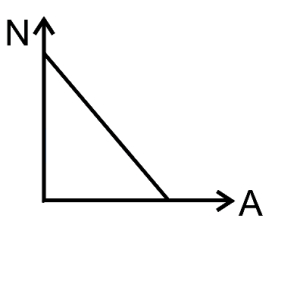
- D
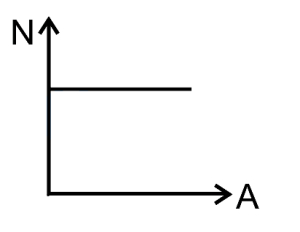
Explore More
Similar Questions
The half-life of radium is $1600 \, \text{years}$. After how many years will $25 \, \text{g}$ of radium remain from $100 \, \text{g}$ of radium?
Difficult
View Solution$A$ sample contains $10^{-2} \ kg$ each of two substances $A$ and $B$ with half-lives $4 \ s$ and $8 \ s$ respectively. The ratio of their atomic weights is $1:2$. The ratio of the amounts (number of atoms) of $A$ and $B$ remaining after $16 \ s$ is $\frac{x}{100}$. The value of $x$ is:
$A$ radioactive nucleus is being produced at a constant rate $\alpha$ per second. Its decay constant is $\lambda$. If $N_0$ is the number of nuclei at time $t = 0$,then the maximum number of nuclei possible is:
Medium
View SolutionThe counting rate observed from a radioactive source at $t=0$ second was $1600$ counts per second and at $t=8$ seconds it was $100$ counts per second. The counting rate observed,as counts per second at $t=6$ seconds,will be
Difficult
View SolutionThe half-life period of a radioactive sample is $3.8 \ days$. After how many days will the sample become $\frac{1}{8}$ of the original substance?
Medium
View SolutionVedclass Products
For Students
Vedclass Test Series
Mock tests in real JEE/NEET style with performance analysis. 5-day free trial.
Start Free TrialFor Teachers
Exam Paper Generator
Generate Set A/B/C/D exam papers from 7.5L+ questions in 2 minutes. 3 chapters free.
Try FreeFor Institutes
Online Exam Module
Live online exams with unlimited students, 360° analytics & white-label branding.
See Demo