
The velocity $v$ of a particle moving along the $x$-axis varies with its position $x$ as $v = \alpha \sqrt{x}$,where $\alpha$ is a constant. Which of the following graphs represents the variation of its acceleration $a$ with time $t$?
- A
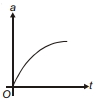
- B
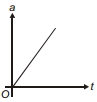
- C
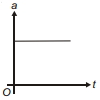
- D
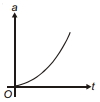
Explore More
Similar Questions
$A$ body travels $102.5 \ m$ in the $n^{\text{th}}$ second and $115.0 \ m$ in the $(n+2)^{\text{th}}$ second. The acceleration is: (in $m/s^2$)
DifficultJEE MAIN 2024
View SolutionAn alpha particle enters a hollow tube of $4 \, m$ length with an initial speed of $1 \, km/s$. It is accelerated in the tube and comes out of it with a speed of $9 \, km/s$. The time for which it remains inside the tube is
Medium
View Solution$A$ body is moving with a uniform acceleration covers $40\,m$ in the first $4\,s$ and $120\,m$ in next $4\,s.$ Its initial velocity and acceleration are
Medium
View Solution$A$ body starts from rest with uniform acceleration. If its velocity after $n$ seconds is $\upsilon$,then its displacement in the last two seconds is
Difficult
View SolutionTwo bodies $A$ and $B$ start from the same point at the same instant and move along a straight line. Body $A$ moves with uniform acceleration $a$ and body $B$ moves with uniform velocity $V$. They meet after time $t$. The value of $t$ is
Vedclass Products
For Students
Vedclass Test Series
Mock tests in real JEE/NEET style with performance analysis. 5-day free trial.
Start Free TrialFor Teachers
Exam Paper Generator
Generate Set A/B/C/D exam papers from 7.5L+ questions in 2 minutes. 3 chapters free.
Try FreeFor Institutes
Online Exam Module
Live online exams with unlimited students, 360° analytics & white-label branding.
See Demo