
Class 11PhysicsOscillationsDifferent types of oscillations (Free, Damped, Forced Oscillation and Resonance)
MediumWhich of the diagrams shown in the figure represents the variation of total mechanical energy of a pendulum oscillating in water as a function of time?
- A
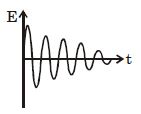
- B
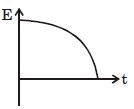
- C
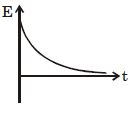
- D
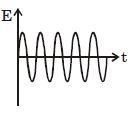
Explore More
Similar Questions
$A$ block of mass $1 \, kg$ attached to a spring is made to oscillate with an initial amplitude of $12 \, cm$. After $2 \, minutes$ the amplitude decreases to $6 \, cm$. Determine the value of the damping constant $b$ for this motion. (Take $\ln 2 = 0.693$)
DifficultJEE MAIN 2021
View SolutionThe amplitude of a damped oscillator becomes half in $1$ minute. The amplitude after $3$ minutes will be $\frac{1}{x}$ times the original. Then $x$ is
What is pure simple harmonic oscillation? Why is it not $100 \%$ possible in practice?
Medium
View SolutionIf a simple pendulum has significant amplitude (up to a factor of $1/e$ of original) only in the period between $t = 0 \ s$ to $t = \tau \ s$,then $\tau$ may be called the average life of the pendulum. When the spherical bob of the pendulum suffers a retardation (due to viscous drag) proportional to its velocity with $b$ as the constant of proportionality,the average life time of the pendulum is (assuming damping is small) in seconds:
DifficultAIEEE 2012
View SolutionThe amplitude of a damped oscillator decreases to $0.9$ times its original magnitude in $5 \ s$. In another $10 \ s$ it will decrease to $\alpha$ times its original magnitude,where $\alpha$ equals
Vedclass Products
For Students
Vedclass Test Series
Mock tests in real JEE/NEET style with performance analysis. 5-day free trial.
Start Free TrialFor Teachers
Exam Paper Generator
Generate Set A/B/C/D exam papers from 7.5L+ questions in 2 minutes. 3 chapters free.
Try FreeFor Institutes
Online Exam Module
Live online exams with unlimited students, 360° analytics & white-label branding.
See Demo