
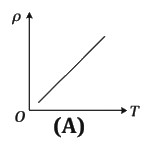
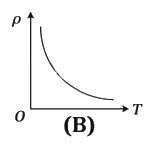
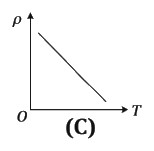
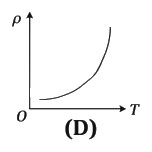
Which of the following graphs represents the temperature $(T)$ dependence of resistivity $(\rho)$ of a semiconductor?
- A
- B
- C
- D
Explore More
Similar Questions
The relation between the number of free electrons in semiconductors $(n)$ and its temperature $(T)$ is
Medium
View SolutionThe explanation of the band structure in solids is due to:
Medium
View SolutionIn a semiconductor,
The energy band gap (distance between the conduction band and valence band) in a conductor is
$A$ piece of copper and another of germanium are cooled from room temperature to $80\, K$. Which of the following is a correct statement?
Vedclass Products
For Students
Vedclass Test Series
Mock tests in real JEE/NEET style with performance analysis. 5-day free trial.
Start Free TrialFor Teachers
Exam Paper Generator
Generate Set A/B/C/D exam papers from 7.5L+ questions in 2 minutes. 3 chapters free.
Try FreeFor Institutes
Online Exam Module
Live online exams with unlimited students, 360° analytics & white-label branding.
See Demo