
Which of the following graphs correctly represents the changes in thermodynamic properties during the formation of $1 \, mol$ of an ideal binary solution?
- A
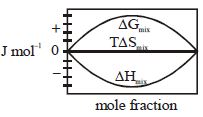
- B
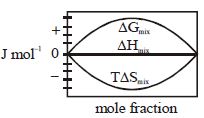
- C
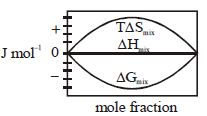
- D
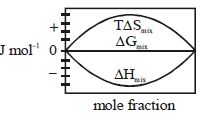
Explore More
Similar Questions
The values of $K_b$ and $K_f$ for water are $0.52 \, K \, kg \, mol^{-1}$ and $1.86 \, K \, kg \, mol^{-1}$ respectively. If the solution boils at $0.78 \, K$ above the boiling point of water,then the freezing point of the solution will be ........ $K$.
Medium
View SolutionAn aqueous solution of $NaCl$ shows the depression of freezing point of water equal to $0.372 \, K$. The boiling point of $BaCl_2$ solution of same molality will be .........$^oC$. $[K_f(H_2O) = 1.86 \, K \, kg \, mol^{-1}; K_b(H_2O) = 0.52 \, K \, kg \, mol^{-1}]$
MediumAIIMS 2011
View SolutionIf ethanol dissolves in water,then which of the following would be done?
Difficult
View SolutionSelect the correct statement.
Difficult
View Solution$A$ Beckmann thermometer is used to measure:
Easy
View SolutionVedclass Products
For Students
Vedclass Test Series
Mock tests in real JEE/NEET style with performance analysis. 5-day free trial.
Start Free TrialFor Teachers
Exam Paper Generator
Generate Set A/B/C/D exam papers from 7.5L+ questions in 2 minutes. 3 chapters free.
Try FreeFor Institutes
Online Exam Module
Live online exams with unlimited students, 360° analytics & white-label branding.
See Demo