
Medium
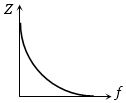
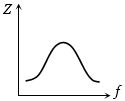
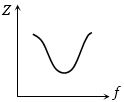
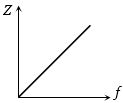
Which one of the following curves represents the variation of impedance $(Z)$ with frequency $(f)$ in a series $LCR$ circuit?
- A
- B
- C
- D
Explore More
Similar Questions
For a series $LCR$ circuit,which of the following statements is correct?
Easy
View SolutionWhen the $rms$ voltages $V_L, V_C$ and $V_R$ are measured respectively across the inductor $L$,the capacitor $C$ and the resistor $R$ in a series $LCR$ circuit connected to an $AC$ source,it is found that the ratio $V_L : V_C : V_R = 1 : 2 : 3$. If the $rms$ voltage of the $AC$ source is $100 \, V$,the $V_R$ is close to........$V$
DifficultJEE MAIN 2014
View SolutionIn a series $LR$ circuit,$X_L = 3R$. Now,a capacitor with $X_C = R$ is added in series. What is the ratio of the new power factor to the old power factor?
Difficult
View SolutionThe $L-C-R$ circuit shown below is driven by an ideal $AC$ voltage source. At frequency $f=\frac{1}{2 \pi \sqrt{L C}}$,choose the correct statement.
In the circuit shown in the figure,what will be the reading of the voltmeter (in $, V$)?
Difficult
View SolutionVedclass Products
For Students
Vedclass Test Series
Mock tests in real JEE/NEET style with performance analysis. 5-day free trial.
Start Free TrialFor Teachers
Exam Paper Generator
Generate Set A/B/C/D exam papers from 7.5L+ questions in 2 minutes. 3 chapters free.
Try FreeFor Institutes
Online Exam Module
Live online exams with unlimited students, 360° analytics & white-label branding.
See Demo