
Which one of the following schematic graphs best represents the variation of $p V$ (in Joules) versus $T$ (in Kelvin) of one mole of an ideal gas? (The dotted line represents $p V=T$)
- A
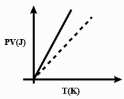
- B
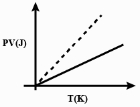
- C
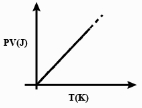
- D
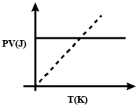
Explore More
Similar Questions
An ideal gas has $N$ molecules in a closed box at temperature $T_1$ and pressure $P_1$. If the number of molecules in the box is doubled and the total kinetic energy is kept the same,what will be the new pressure $P_2$ and temperature $T_2$?
Medium
View SolutionOne mole of an ideal diatomic gas is taken through the cycle as shown in the figure.
$1 \rightarrow 2$: isochoric process
$2 \rightarrow 3$: straight line on $P-V$ diagram
$3 \rightarrow 1$: isobaric process
The average molecular speed of the gas in the states $1, 2$ and $3$ are in the ratio
$1 \rightarrow 2$: isochoric process
$2 \rightarrow 3$: straight line on $P-V$ diagram
$3 \rightarrow 1$: isobaric process
The average molecular speed of the gas in the states $1, 2$ and $3$ are in the ratio
Difficult
View SolutionIn the kinetic theory of gases,which of the following statements regarding elastic collisions of the molecules is wrong?
Easy
View SolutionAn ideal gas at pressure $P$ and temperature $T$ is expanding such that $PT^3 = \text{constant}$. The coefficient of volume expansion of the gas is . . . . . . .
DifficultJEE MAIN 2026
View Solution$A$ thermally insulated vessel containing monatomic gas is moving with a speed of $30 \, m/s$. If the vessel suddenly stops, the increase in gas temperature is (Molar mass of gas $= 83 \, g/mol$ and $R = 8.3 \, J/K \cdot mol$). (in $ \, K$)
Vedclass Products
For Students
Vedclass Test Series
Mock tests in real JEE/NEET style with performance analysis. 5-day free trial.
Start Free TrialFor Teachers
Exam Paper Generator
Generate Set A/B/C/D exam papers from 7.5L+ questions in 2 minutes. 3 chapters free.
Try FreeFor Institutes
Online Exam Module
Live online exams with unlimited students, 360° analytics & white-label branding.
See Demo