
Which of the following graphs represents the variation of $\beta = -(dV/dP)$ with pressure $P$ for an ideal gas kept at a constant temperature?
- A
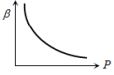
- B

- C
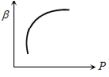
- D
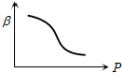
Explore More
Similar Questions
If the collision frequency of hydrogen molecules in a closed chamber at $27^{\circ} C$ is $Z$,then the collision frequency of the same system at $127^{\circ} C$ is :
DifficultJEE MAIN 2024
View SolutionWhich graph represents the molar heat capacity at constant volume $(C_V)$ for a monoatomic gas?
Easy
View SolutionFor the equation $\beta = - \frac{1}{V} \left( \frac{dV}{dP} \right)$, identify the correct graph of $\beta$ versus $P$ for an ideal gas at constant temperature.
Difficult
View SolutionThree vessels of equal capacity have gases at the same temperature and pressure. The first vessel contains neon (monatomic),the second contains chlorine (diatomic),and the third contains uranium hexafluoride (polyatomic). Do the vessels contain equal number of respective molecules? Is the root mean square speed of molecules the same in the three cases? If not,in which case is $v_{rms}$ the largest?
Medium
View SolutionAn ideal gas at pressure $P$ and temperature $T$ is expanding such that $PT^3 = \text{constant}$. The coefficient of volume expansion of the gas is . . . . . . .
DifficultJEE MAIN 2026
View SolutionVedclass Products
For Students
Vedclass Test Series
Mock tests in real JEE/NEET style with performance analysis. 5-day free trial.
Start Free TrialFor Teachers
Exam Paper Generator
Generate Set A/B/C/D exam papers from 7.5L+ questions in 2 minutes. 3 chapters free.
Try FreeFor Institutes
Online Exam Module
Live online exams with unlimited students, 360° analytics & white-label branding.
See Demo