
Which graph represents the molar heat capacity at constant volume $(C_V)$ for a monoatomic gas?
- A
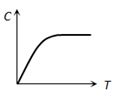
- B
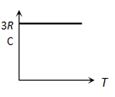
- C
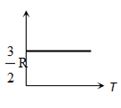
- D
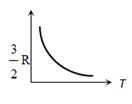
Explore More
Similar Questions
Which of the following graphs represents the variation of $\beta = -(dV/dP)$ with pressure $P$ for an ideal gas kept at a constant temperature?
Difficult
View SolutionOne mole of an ideal diatomic gas is taken through the cycle as shown in the figure.
$1 \rightarrow 2$: isochoric process
$2 \rightarrow 3$: straight line on $P-V$ diagram
$3 \rightarrow 1$: isobaric process
The average molecular speed of the gas in the states $1, 2$ and $3$ are in the ratio
$1 \rightarrow 2$: isochoric process
$2 \rightarrow 3$: straight line on $P-V$ diagram
$3 \rightarrow 1$: isobaric process
The average molecular speed of the gas in the states $1, 2$ and $3$ are in the ratio
Difficult
View SolutionIn the kinetic theory of gases,which of the following statements regarding elastic collisions of the molecules is wrong?
Easy
View SolutionSpeed of sound in a gas is $v$ and $r.m.s.$ velocity of the gas molecules is $c.$ The ratio of $v$ to $c$ is
Medium
View Solution$A$ very tall vertical cylinder is filled with a gas of molar mass $M$ under isothermal conditions at temperature $T$. The density and pressure of the gas at the base of the container are $\rho_0$ and $p_0$,respectively. Choose the correct statement$(s)$.
Vedclass Products
For Students
Vedclass Test Series
Mock tests in real JEE/NEET style with performance analysis. 5-day free trial.
Start Free TrialFor Teachers
Exam Paper Generator
Generate Set A/B/C/D exam papers from 7.5L+ questions in 2 minutes. 3 chapters free.
Try FreeFor Institutes
Online Exam Module
Live online exams with unlimited students, 360° analytics & white-label branding.
See Demo