
$A$ sample of a radioactive nucleus $A$ disintegrates to another radioactive nucleus $B$,which in turn disintegrates to some other stable nucleus $C$. Plot a graph showing the variation of the number of atoms of nucleus $B$ versus time:
(Assume that at $t=0$,there are no $B$ atoms in the sample)
(Assume that at $t=0$,there are no $B$ atoms in the sample)
- A
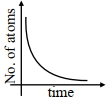
- B
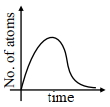
- C
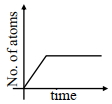
- D
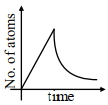
Explore More
Similar Questions
$A$ nucleus $_Z{X^A}$ emits $3 \alpha$-particles and $5 \beta$-particles. The ratio of total neutrons to protons in the final nucleus is:
Medium
View SolutionWhen an element ${}_{90}^{232}Th$ decays into ${}_{82}^{208}Pb$, the number of $\alpha$ and $\beta^{-}$ particles emitted respectively are
$A$ radioactive element forms its own isotope after $3$ consecutive disintegrations. The particles emitted are
The intensity of gamma radiation from a given source is $I$. On passing through $36 \, mm$ of lead,it is reduced to $\frac{I}{8}$. The thickness of lead which will reduce the intensity to $\frac{I}{2}$ will be......$mm$
DifficultAIEEE 2005
View Solution$A$ radioactive substance emits
Easy
View SolutionVedclass Products
For Students
Vedclass Test Series
Mock tests in real JEE/NEET style with performance analysis. 5-day free trial.
Start Free TrialFor Teachers
Exam Paper Generator
Generate Set A/B/C/D exam papers from 7.5L+ questions in 2 minutes. 3 chapters free.
Try FreeFor Institutes
Online Exam Module
Live online exams with unlimited students, 360° analytics & white-label branding.
See Demo