
In a simple harmonic motion, let $f$ be the acceleration and $T$ be the time period. If $x$ denotes the displacement, then the $|fT|$ vs. $x$ graph will look like,
- A
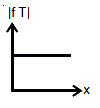
- B
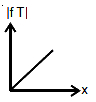
- C
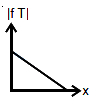
- D
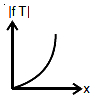
Explore More
Similar Questions
$A$ coin is placed on a horizontal platform which undergoes vertical simple harmonic motion of angular frequency $\omega$. The amplitude of oscillation is gradually increased. The coin will leave contact with the platform for the first time
MediumAIEEE 2006
View Solution$A$ particle is executing $S.H.M.$ Then the graph of acceleration as a function of displacement is
Medium
View SolutionThe graphs in the figure show that a quantity $y$ varies with displacement $d$ in a system undergoing simple harmonic motion. Which graph best represents the relationship obtained when $y$ is the unbalanced force acting on the system?
Medium
View Solution$A$ particle is executing simple harmonic motion with an amplitude of $0.02 \ m$ and frequency $50 \ Hz$. The maximum acceleration of the particle is
Easy
View Solution$A$ particle is performing $S.H.M.$ starting from the extreme position. The graphical representation shows that between displacement and acceleration,there is a phase difference of:
Vedclass Products
For Students
Vedclass Test Series
Mock tests in real JEE/NEET style with performance analysis. 5-day free trial.
Start Free TrialFor Teachers
Exam Paper Generator
Generate Set A/B/C/D exam papers from 7.5L+ questions in 2 minutes. 3 chapters free.
Try FreeFor Institutes
Online Exam Module
Live online exams with unlimited students, 360° analytics & white-label branding.
See Demo