
In an $L-R$ circuit connected to a battery,the rate at which energy is stored in the inductor is plotted against time during the growth of the current in the circuit. Which of the following best represents the resulting curve?
- A
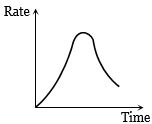
- B
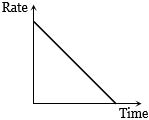
- C
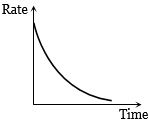
- D
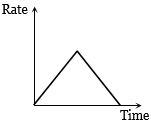
Explore More
Similar Questions
$A$ square coil $ABCD$ is placed in the $x-y$ plane with its centre at the origin. $A$ long straight wire,passing through the origin,carries a current in the negative $z$-direction. The current in this wire increases with time. The induced current in the coil is:
Medium
View Solution$A$ square loop of side $2 \,cm$ enters a magnetic field with a constant speed of $2 \,cm \,s^{-1}$ as shown. The front edge enters the field at $t=0 \,s$. Which of the following graphs correctly depicts the induced emf in the loop? (Take clockwise direction as positive)
MediumKCET 2023
View SolutionTwo identical coaxial circular loops carry a current $i$ each,circulating in the same direction. If the loops approach each other,then:
$A$ magnet is made to oscillate with a particular frequency,passing through a coil as shown in the figure. The time variation of the magnitude of $e.m.f.$ generated across the coil during one cycle is
MediumAIIMS 2005
View SolutionThe diagram below shows two coils $A$ and $B$ placed parallel to each other at a very small distance. Coil $A$ is connected to an ac supply. $G$ is a very sensitive galvanometer. When the key $K$ is closed:
Easy
View SolutionVedclass Products
For Students
Vedclass Test Series
Mock tests in real JEE/NEET style with performance analysis. 5-day free trial.
Start Free TrialFor Teachers
Exam Paper Generator
Generate Set A/B/C/D exam papers from 7.5L+ questions in 2 minutes. 3 chapters free.
Try FreeFor Institutes
Online Exam Module
Live online exams with unlimited students, 360° analytics & white-label branding.
See Demo