
Medium
Which of the following graphs best represents the motion of a raindrop?
- A
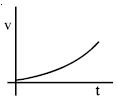
- B
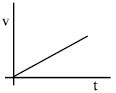
- C
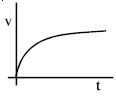
- D
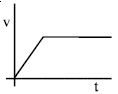
Explore More
Similar Questions
Eight equal drops of water are falling through air with a steady velocity of $10 \,cm \,s^{-1}$. If the drops combine to form a single drop, then the terminal velocity of this big drop is:
DifficultKCET 2011
View SolutionIf the average terminal velocity of a rain drop is $2 \,m/s$, then the energy transferred by rain to each square metre of the surface at a place which receives $100 \,cm$ of rain in a year is
Eight identical drops of water falling through air with a uniform terminal velocity of $10 \ cm/s$ combine to form a single big drop. The terminal velocity of the big drop will be: (in $cm/s$)
DifficultMHT CET 2019
View SolutionWhat is the terminal velocity of a rain drop of radius $0.02 \ mm$ (in $cm \ s^{-1}$)? [Note that the coefficient of viscosity of air is $1.8 \times 10^{-5} \ N \ s \ m^{-2}$, density of water is $1000 \ kg \ m^{-3}$. Use $g = 10 \ m \ s^{-2}$ and density of air can be neglected in comparison with the density of water.]
$A$ viscous fluid is flowing through a cylindrical tube. The velocity distribution of the fluid is best represented by the diagram
Easy
View SolutionVedclass Products
For Students
Vedclass Test Series
Mock tests in real JEE/NEET style with performance analysis. 5-day free trial.
Start Free TrialFor Teachers
Exam Paper Generator
Generate Set A/B/C/D exam papers from 7.5L+ questions in 2 minutes. 3 chapters free.
Try FreeFor Institutes
Online Exam Module
Live online exams with unlimited students, 360° analytics & white-label branding.
See Demo