
Which one of the following represents the graph between $\log p$ (on $Y$-axis) and $\frac{1}{T}$ (on $X$-axis)?
($p=$ vapour pressure of a liquid,$T=$ absolute temperature)
($p=$ vapour pressure of a liquid,$T=$ absolute temperature)
- A
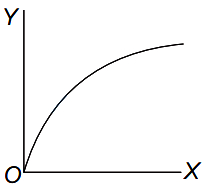
- B
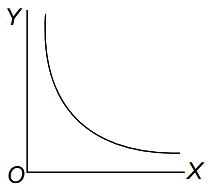
- C
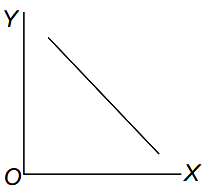
- D
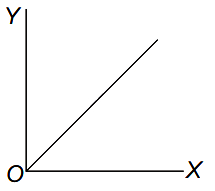
Explore More
Similar Questions
Ethanol,when reacted with $PCl_5$,gives $A$,$POCl_3$,and $HCl$. $A$ reacts with silver nitrite to form $B$ (major product) and $AgCl$. $A$ and $B$ are respectively:
If $p \rightarrow (\sim p \vee \sim q)$ is false,then the truth values of $p$ and $q$ are respectively:
If $10$ volumes of dihydrogen gas reacts with $5$ volumes of dioxygen gas,how many volumes of water vapour would be produced?
On a temperature scale $Y$,water freezes at $-160^{\circ} Y$ and boils at $-50^{\circ} Y$. On this $Y$ scale,a temperature of $340 \ K$ is (in $^{\circ} Y$)
Most of the endangered species are the victims of
Vedclass Products
For Students
Vedclass Test Series
Mock tests in real JEE/NEET style with performance analysis. 5-day free trial.
Start Free TrialFor Teachers
Exam Paper Generator
Generate Set A/B/C/D exam papers from 7.5L+ questions in 2 minutes. 3 chapters free.
Try FreeFor Institutes
Online Exam Module
Live online exams with unlimited students, 360° analytics & white-label branding.
See Demo